Best Betting Analysis Tools for 2026: Top Picks
Table of Contents
- How to Compare Betting Odds and Analysis Tools in 2026
- AI Sports Betting Analysis Tools: What They Do and Who They're For
- Sports Betting Probability Calculator: Turning Lines into Edges
- Sports Betting Tools for Player Props: What to Look For
- How to Compare Betting Odds Across Sportsbooks
- Performance Tracking, ROI, and Long-Term Results
- Choosing the Right Tool by Bettor Type and Sport
- Frequently Asked Questions
Last Updated: October 6, 2026
How to Compare Betting Odds and Analysis Tools in 2026
The best betting analysis tools for 2026 are the ones that show you their math, not just their picks.
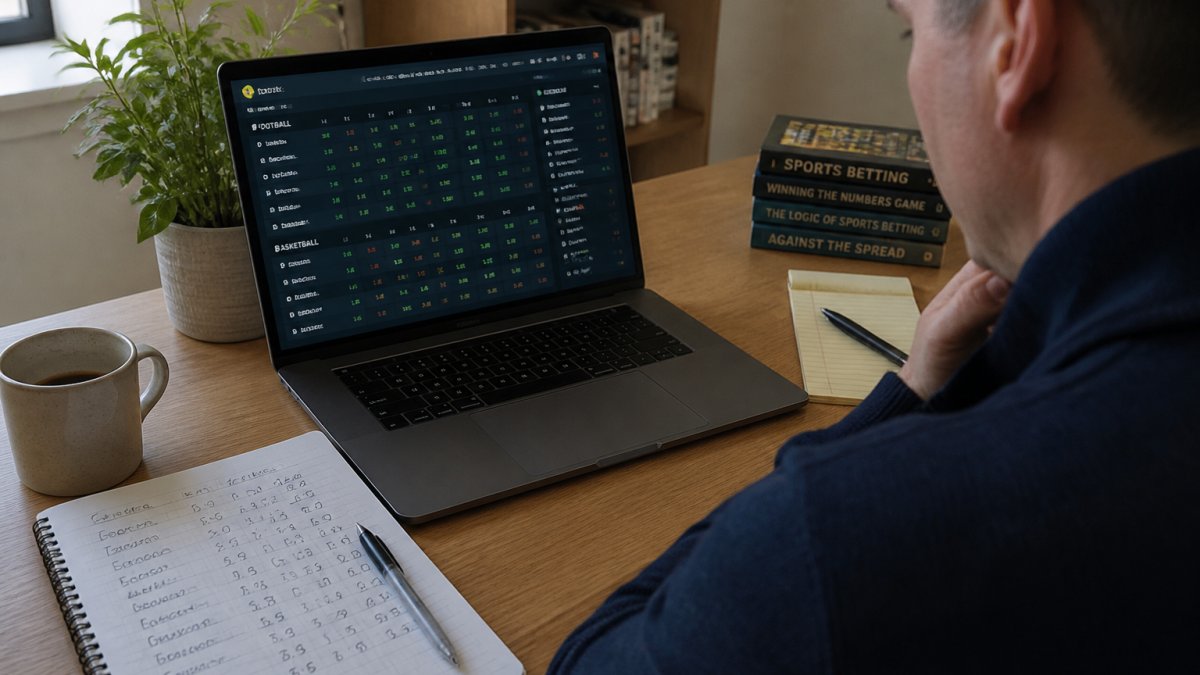
Most bettors lose not because they pick badly, but because they never measure whether their picks were good. A common mistake is judging a tool by a hot week instead of a full season of graded results.
Comparison Table: Features and Pricing at a Glance
| Tool Type | Core Output | Transparency | Pricing Model | Best For |
|---|---|---|---|---|
| AI analysis platforms | Confidence scores, written breakdowns | Public graded record | Subscription, free daily picks | Bettors who want reasoning |
| Probability calculators | Implied vs. true probability | Formula is visible | Free or low-cost | Line shoppers |
| Prop research tools | Player projections, matchup data | Varies widely | Tiered subscriptions | Prop bettors |
| Manual spreadsheets | Custom models | Fully transparent | Your time | Tinkerers |
Pricing across this category varies by provider and plan tier, so check each tool's own site for current rates. Heater publishes its pricing on our website and offers daily free analysis you can audit before paying anything.
Evaluation Criteria: What Separates a Good Tool from a Great One
A great betting analysis tool does four things: it shows its inputs, grades its own picks publicly, explains the reasoning in plain language, and tells you when to pass. That last one matters more than most bettors realize.
- Transparency: Can you see the full record, including losses?
- Method: Does it explain why a number is an edge, or just hand you a pick?
- Coverage: Which sports, markets, and bet types does it actually model?
What most reviews miss is that a tool without a graded record is unfalsifiable. You cannot tell skill from luck.
AI Sports Betting Analysis Tools: What They Do and Who They're For
AI sports betting analysis tools convert market prices and historical data into probabilities, then compare those probabilities against the odds on offer. The output is a valuation: is this line mispriced, and by how much. Heater runs this process across NFL, College Football, NHL, MLB, NBA, College Basketball, and the PGA, returning a confidence score and a written breakdown for each recommendation.
How AI Tools Convert Odds into Probabilities
Every moneyline, spread, and total carries an implied probability baked into the price. An AI tool strips out the bookmaker's margin, models the underlying event, and produces its own probability estimate. When the model's number is meaningfully higher than the implied number, that gap is your edge. When it isn't, the honest answer is a pass.
Independent Simulations vs. Traditional Handicapping
Traditional handicapping leans on one analyst's judgment. Independent simulations run the same matchup thousands of times and let the distribution speak. The trade-off is real: simulations can miss late-breaking news like a scratched starter, which is why Heater factors injury reports, pace, and weather into the model rather than treating them as afterthoughts.
Sports Betting Probability Calculator: Turning Lines into Edges
A sports betting probability calculator turns a set of odds into an implied probability so you can compare it against your own estimate. It is the simplest, most underused tool in a bettor's kit. If a team is priced at -150, the implied probability is 60%, and any true probability above that is a theoretical edge.
Implied Probability vs. True Probability
Implied probability is what the price says. True probability is what you believe, based on data. The entire discipline of value betting lives in the gap between them. A calculator makes the first number instant; the second number is where a model like Heater's earns its keep by running its own simulations rather than borrowing the market's opinion.
Sports Betting Tools for Player Props: What to Look For
Sports betting tools for player props need deeper data than game-level models: usage rates, matchup history, and role changes. Prop markets are less efficient than moneylines, which is exactly why they reward better research. Look for a tool that models specific prop types rather than applying one generic number to every market.
Prop Bet Markets Covered by Leading Tools
Coverage is the first question to ask. Some tools handle only the majors; others go deep on niche markets. Heater builds purpose-specific models for spreads, totals, moneyline, and player props, so a strikeout prop and a total bases prop are evaluated on their own terms rather than through a shared formula.
| Prop Market | Key Inputs | What to Check |
|---|---|---|
| Pitcher strikeouts | Pitch count trends, opponent K rate | Bullpen usage |
| Total bases | Exit velocity, park factors | Weather, lineup spot |
| Points/rebounds | Pace, minutes projection | Injury news |
| Golf placements | Course fit, recent form | Tee times, wind |
How to Compare Betting Odds Across Sportsbooks
Comparing betting odds across sportsbooks is the fastest free edge available to any bettor, and almost no analysis tool review covers it properly. The same game is frequently priced differently at different books, and shopping the best number is worth more over a season than most pick services. Line shopping costs nothing and requires no model, just accounts at multiple books and a habit of checking before you bet.
The Vig, the Hold, and Why It Matters
Every price a book posts includes a margin, often called the vig or hold. On a standard -110/-110 spread, the implied probabilities are 52.38% each, which sums to 104.76%. That extra 4.76% is the book's edge. If you compare raw implied probabilities across books without removing the hold, every line looks like a losing proposition. Strip the margin first, convert both sides to no-vig probabilities, and then compare.
Line Movement and Market Analysis
Line movement tells you where sharp money is going. When a line opens at -3 and closes at -4.5, the market has repriced the game, and understanding why sharpens your own read. Track opening versus closing numbers for the sports you bet most, and note which books move first in your market. A common pattern is that sharper books move first and softer books follow; if you can bet the soft book before it adjusts, you capture closing-line value.
- Record the opening line and the closing line for every bet
- Note which book you took and whether a better number existed
- Flag games where the line moved more than a point
A Repeatable Odds-Shopping Routine
A simple routine beats a complicated one. Before placing any bet, check at least three books for the same market. If the best price is more than a few cents better than the worst, that difference compounds over hundreds of bets. For props, the gaps are often wider because books price player markets less efficiently. Tools that aggregate odds across books can speed this up, but the discipline of checking is what actually captures the edge.
Where Analysis Tools Fit In
Odds comparison and analysis tools solve different problems. A comparison tool tells you where the best price is; an analysis tool tells you whether the price is worth taking. The strongest workflow uses both: the analysis tool identifies a potential edge, and the odds comparison confirms you are getting the best available number on that edge. Skipping either step leaves money on the table.
Performance Tracking, ROI, and Long-Term Results
Performance tracking is what turns betting from a hobby into a measurable operation. Track every wager, graded, with the odds you actually got.
A public, graded record is the strongest signal of a tool's credibility. Heater logs and grades picks publicly, including a record of 60%+ confidence selections, so you can audit the model's performance rather than trust a screenshot.
Choosing the Right Tool by Bettor Type and Sport
The right tool depends on how you bet, not on which platform has the loudest marketing. Most tool reviews list features without telling you who each tool is actually for. This section fixes that with a decision framework by bettor type and sport, so you can match the tool to your behavior and commit to one for a full season before judging it.
Match the Tool to Your Bettor Type
- Feel-based bettors: Start with a tool that explains its reasoning in writing, so you learn the why behind each number. If a tool only gives you a pick with no explanation, it will not help you improve. Look for written breakdowns, confidence scores with context, and pass recommendations.
- Prop specialists: Prioritize deep prop coverage and player-level models. Game-level models often apply generic assumptions to props, which is a mistake. A tool that models usage rates, matchup history, and role changes separately for each prop type will outperform one that reuses a single formula.
- Line shoppers: A probability calculator plus accounts at multiple books is enough. You do not need a full simulation model if your edge comes from price differences. Focus on no-vig calculators and odds comparison tools.
Sport-Specific Tool Needs
Different sports reward different data. A tool that is excellent for NFL spreads may be weak for MLB player props. Here is what to prioritize by sport:
- NFL and College Football: Injury reports, pace, weather, and line movement matter most. Tools that update quickly after injury news have an edge.
- NBA and College Basketball: Pace, minutes projections, and rest days drive totals and props. Tools that model rotation changes are valuable.
- MLB: Pitching matchups, bullpen usage, park factors, and weather are critical. Prop tools that model strikeouts and total bases separately are essential.
A Simple Decision Checklist
Before committing to any tool, ask:
- Does it cover the sports and markets I actually bet?
- Does it show its inputs and grade its own picks publicly?
- Does it explain reasoning in plain language?
- Does it tell me when to pass?
- Does it fit my budget and betting volume?
If a tool fails the first two questions, it is not worth your time regardless of marketing claims.
Heater is built for bettors who want the reasoning, not just the pick.
If you're coming from a picks-only service, expect an adjustment period. The first month is about learning to read the breakdowns and trusting the pass recommendations.
Frequently Asked Questions
What features should I look for in a sports betting analysis tool?
Focus on tools that show a public, graded track record, provide written breakdowns with confidence scores, and cover the sports and bet types you actually wager on. Check whether the tool offers a probability calculator, player prop analysis, and transparent pass recommendations when no edge exists. Pricing and free trial access matter too, so you can audit the model's performance before committing. Avoid tools that only give picks without explaining the reasoning or showing long-term results.
Can AI tools help analyze sports betting odds?
Yes. AI sports betting analysis tools convert bookmaker prices into implied probabilities, then run independent simulations to estimate true probabilities. The difference between the two reveals potential value. Tools like Heater provide written breakdowns and confidence scores for each recommendation, covering spreads, totals, moneylines, and player props across NFL, NBA, MLB, NHL, college sports, and PGA. This helps you compare odds across books and identify where the market may be mispriced.
How do betting analysis tools compare bookmaker odds with probabilities?
The tool first converts the bookmaker's odds into an implied probability. For example, -150 odds imply a 60% chance. Then it runs simulations or statistical models to estimate the true probability based on historical performance, matchups, and other data. If the true probability is higher than the implied probability, that signals a potential edge. Tools like Heater show this comparison directly, along with a confidence score and written reasoning, so you can decide whether the bet is worth making.
Are sports betting analysis tools accurate?
Accuracy varies by tool and sport. The most reliable tools publish a public, graded track record so you can verify results over time. Heater, for instance, logs and grades all picks since July 1, 2026, including 60%+ confidence picks. No tool guarantees wins, and short-term variance is normal. Look for transparency in how picks are graded, whether losses are included, and whether the tool offers a free daily analysis you can audit before paying.
Betting without a system means guessing, and guessing has a cost you can never measure. Heater gives you an AI-powered analysis tool with a public, graded track record, purpose-built models for spreads, totals, moneylines, and player props, plus transparent pass recommendations when no edge exists. Get started with Heater and build a data-backed betting strategy you can actually audit.